Prerequisites
- Create a Nobl9 free account
- Create a free Pingdom account
Part One: Create Pingdom Account
During this stage we focus on getting our Pingdom environment working and creating a Ping monitor to start the flow of data.
For this you first need to open a free account with Pingdom, please follow the link below:
![SLOconf Lab - Nobl9 (1)[29] SLOconf Lab - Nobl9 (1)[29]](https://www.sloconf.com/hubfs/SLOconf%20Lab%20-%20Nobl9%20(1)%5B29%5D.jpg)
After entering your information, click on start a Free Trial which will navigate you to the next page where you enter some more information.
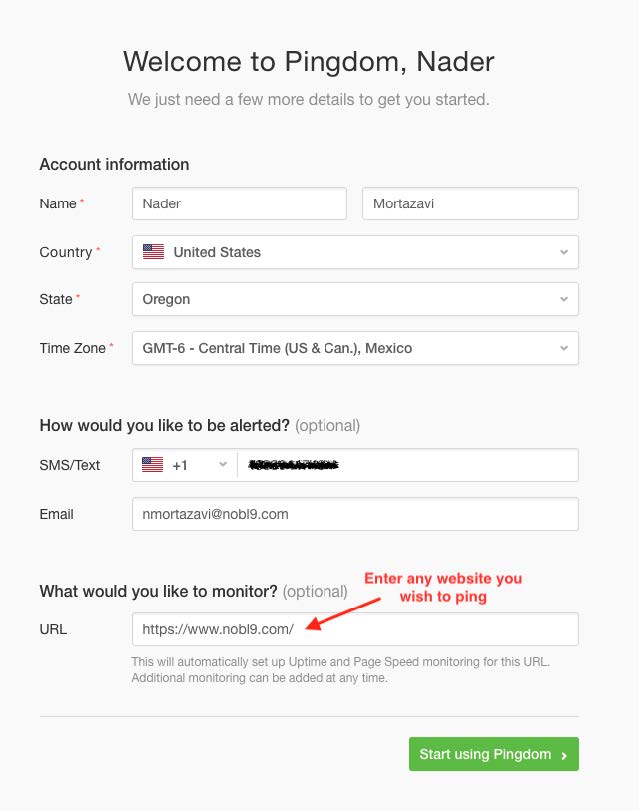
After you navigate to the next page you will see that you already have one Uptime monitor created. Click on the Uptime box which will navigate you to the details page
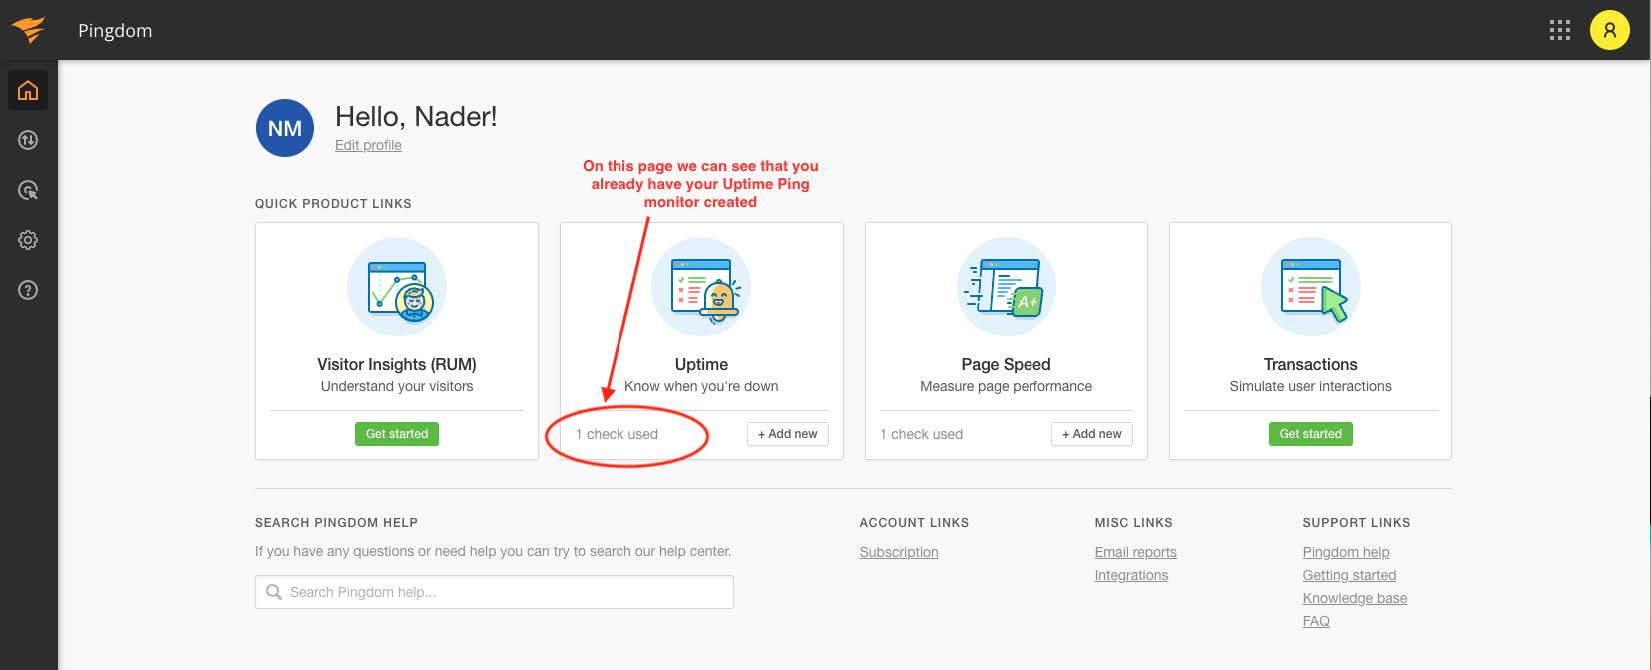
Next you will see that your Site name is showing but there is no data yet since the default ping time is set to 5 minutes. Let’s change that to 1 minute. Once you see the monitor you created in the next page, click on monitor name and then click on “Edit Check” on the top right.

Once you navigate to the next page, change the Check Interval from the default 5-minutes to recommended 1-minute and hit Modify Check.
We are not finished with everything we need to do in Pingdom.
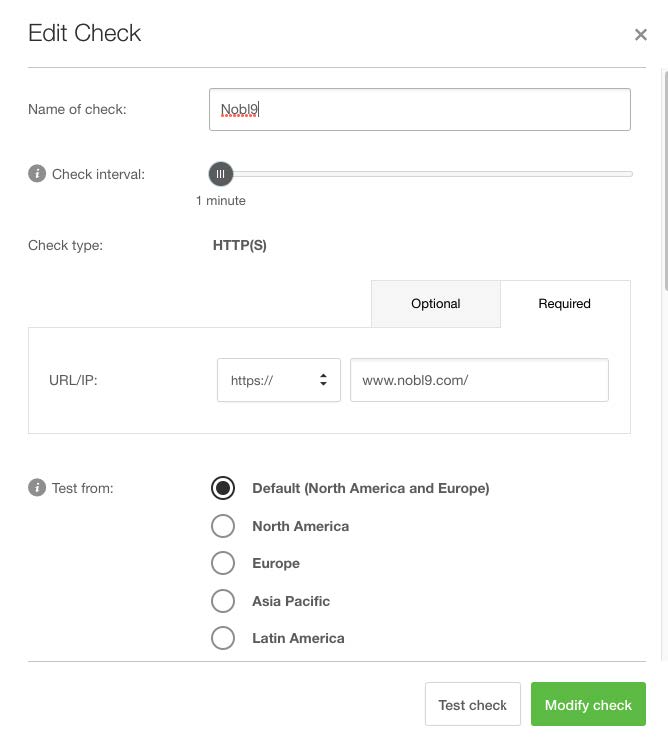
Part two: Create a Data Source in Nobl9
In this stage, we are going to login to our Nobl9 instance and create a data source for Pingdom. We still need information from your pingdom account so please stay logged in. For this part there is extensive documentation at https://docs.nobl9.com/ just in case you need further guidance for accomplishing the tasks.
Once you login to your account you need to create a data source as the first step and connect the Pingdom instance to Nobl9. Below are the instructions:
- Navigate to the Integrations section of the web UI.
- Click the
 button on the Sources tab to define a data source.
 - Select Agent for the connection type and configure the data source.
- Click the Add Data Source button.
You should now be seeing this page: Click
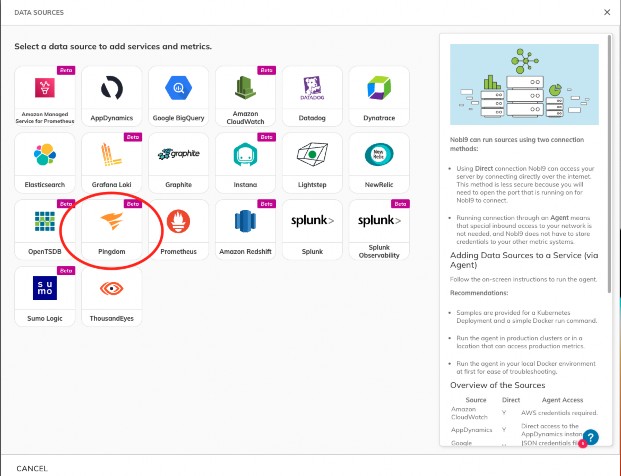
Click on the Pingdom data source and choose the Direct connection. There is some information that you need to provide to get this connection established.
Go back to your Pingdom account and click on Setting and then at the bottom of the list choose “Pingdom API”.
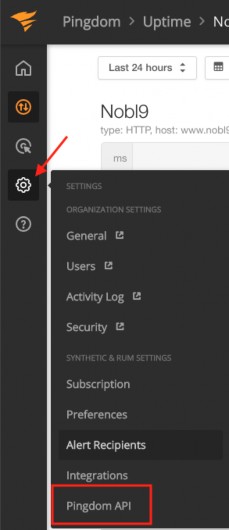
In the next page, click on “Add API Token”
Give a name to your API Key and click “Generate Token”
You should now see the page below where you can copy your new API keys into the clipboard.
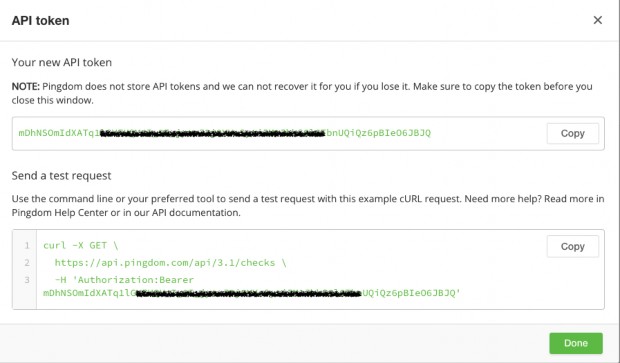
Once you copy the Token, then start filling out the information for the Nobl9 data source integration.
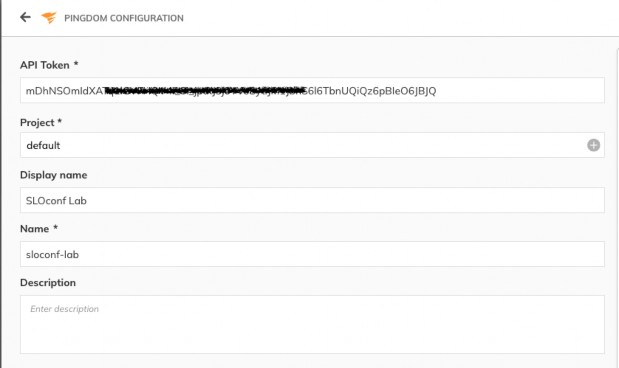
Once you click on Add Data Source you should be able to see that in that connection in the Integration tab.
This will conclude the Part two of the lab.
Part three: Create a Service
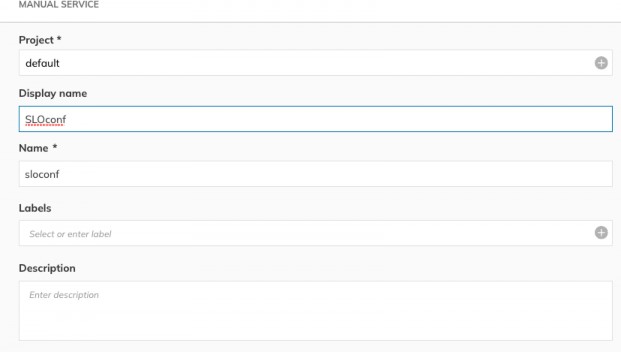
Before you can start creating SLOs, you have to create a project to put them in. To create a Service:
- Go to Catalog > Service.
- Click the
 button.
 - Choose the Default project where you created upon creating your Data Source.
- Enter a Display name (optional).
- Add an optional Description.
- Click the Create Service button.
Part four: Create Your First SLO
For this part we will use the SLO Wizard on the UI to create our first SLO from the data we are receiving from Pingdom. Below are the instructions.
Complete the following steps to create an SLO in the Nobl9 UI:
- Navigate to the Service Level Objectives page.
- Click the
 button to start the SLO wizard, and follow the five-step configuration process in the wizard.
 - In step 1, select the Service you created in the previous step from the drop-down list to tag the service this SLO applies to.
- In step 2, choose a Pingdom as your Data Source from the drop-down list.
- We will use the Threshold metric here and we need to get the Check ID from your Pingdom account. To do that navigate back to your Pingdom account and extract that ID from the URL.
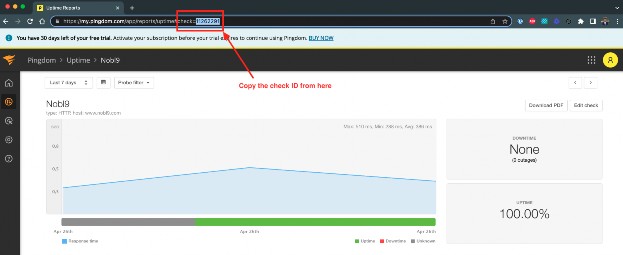
You can then copy that ID in Nobl9 and choose the status for your SLO
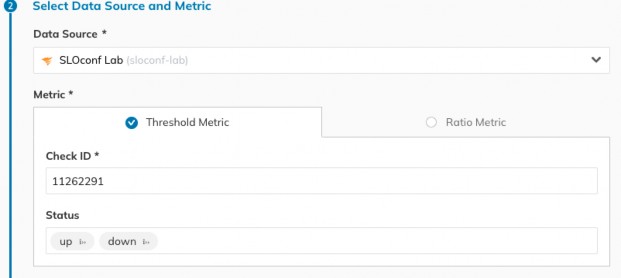
- In step 3, choose a 1- Hour Rolling Time Window:
- In step 4, select the Occurrence Error Budget Calculation Method
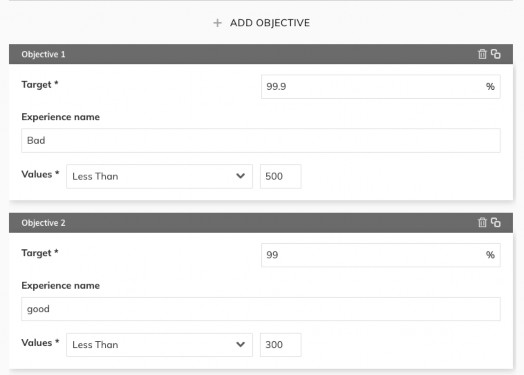
This is one of the most important stages of SLO creation which is where you decide what threshold and target you need to set for your SLO. There are plenty of resources that could help you with this decision.
For this SLO we have some metrics that help us decide.
Max: 510 ms, Min: 288 ms, Avg: 392 ms
Based on these metrics we can create two objectives, one for something around the Average which will give us the majority of the acceptable load-time and then one closer to the Maximum that is not the ideal experience. Below are what I chose for this SLO:
- In step 5, enter a Name for your objective.
Part five: Create an Alert
This section is split into two parts, the first one we are going to create a Alert Method for the alert to be sent to, then we are going to create an alert:
Create Slack Alert Method
To set up the Alert Method in the Nobl9 UI, follow these steps:
- Go to Integrations > Alert Methods.
- Click the
 button.
 - Select Slack.
- Enter the URL.
This is your Incoming Webhook URL. It must start with https://hooks.slack.com/. - Select a Project (default).
- Enter a Display name (optional). You can enter a friendly name with spaces in this field.
- Enter a Name. a. Let’s call it “sloconf”
- Enter a Description (optional). Here you can add details such as who is responsible for the integration (team/owner) and the purpose of creating it.
- Click the Add Alert Method button.
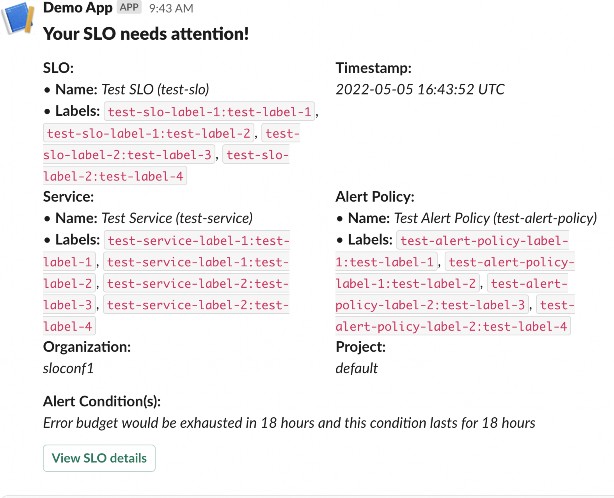
Once you follow through the steps above, you will have an Alert Method created that will look like the below picture. Go ahead and send a test notification to Slack so you can verify that the integration is working.

Your notification test in slack should look like this:
Create a Simple Alert
There are three different scenarios where you can create an alert in Nobl9 for the SLO, for the purpose of this lab we are going to use the second case which looks at the remaining error budget. Here are the steps:
- Navigate to the Alerts page.
- Click the button to start the Alerts Policy wizard, and follow the configuration process in the wizard.
- In step 1:
- Define your Alert Conditions by selecting one or more of the boxes and choosing your parameters.
- The Remaining error budget is the amount left from the error budget set in the SLO. Let’s set that to 25%
- Leave the Cooldown period for your Alert Policy as the default
- Cooldown period value is mandatory, and it must be an integer value greater than or equal to 5 minutes.
- Define your Alert Conditions by selecting one or more of the boxes and choosing your parameters.
- In step 2, select a Project, then enter a Display name (sloconf) and a Name for the alert (this is mandatory and will be filled in automatically if you provide a display name). Let’s set the severity to Medium
- In step 3, select the box for the Slack alert we just created.
You can send another test alert to see how the alert will look like in Slack.
Conclusion
I’d like to thank everyone who took the time to follow this handbook to go through this lab.
Upon successful completion you should have a Pingdom account and a Nobl9 account, in the Pingdom account you should have one ping monitor and in Nobl9, you have the following:
- Data Source for Pingdom
- Your first SLO
- Alert Method for Slack
- Your first Alert
